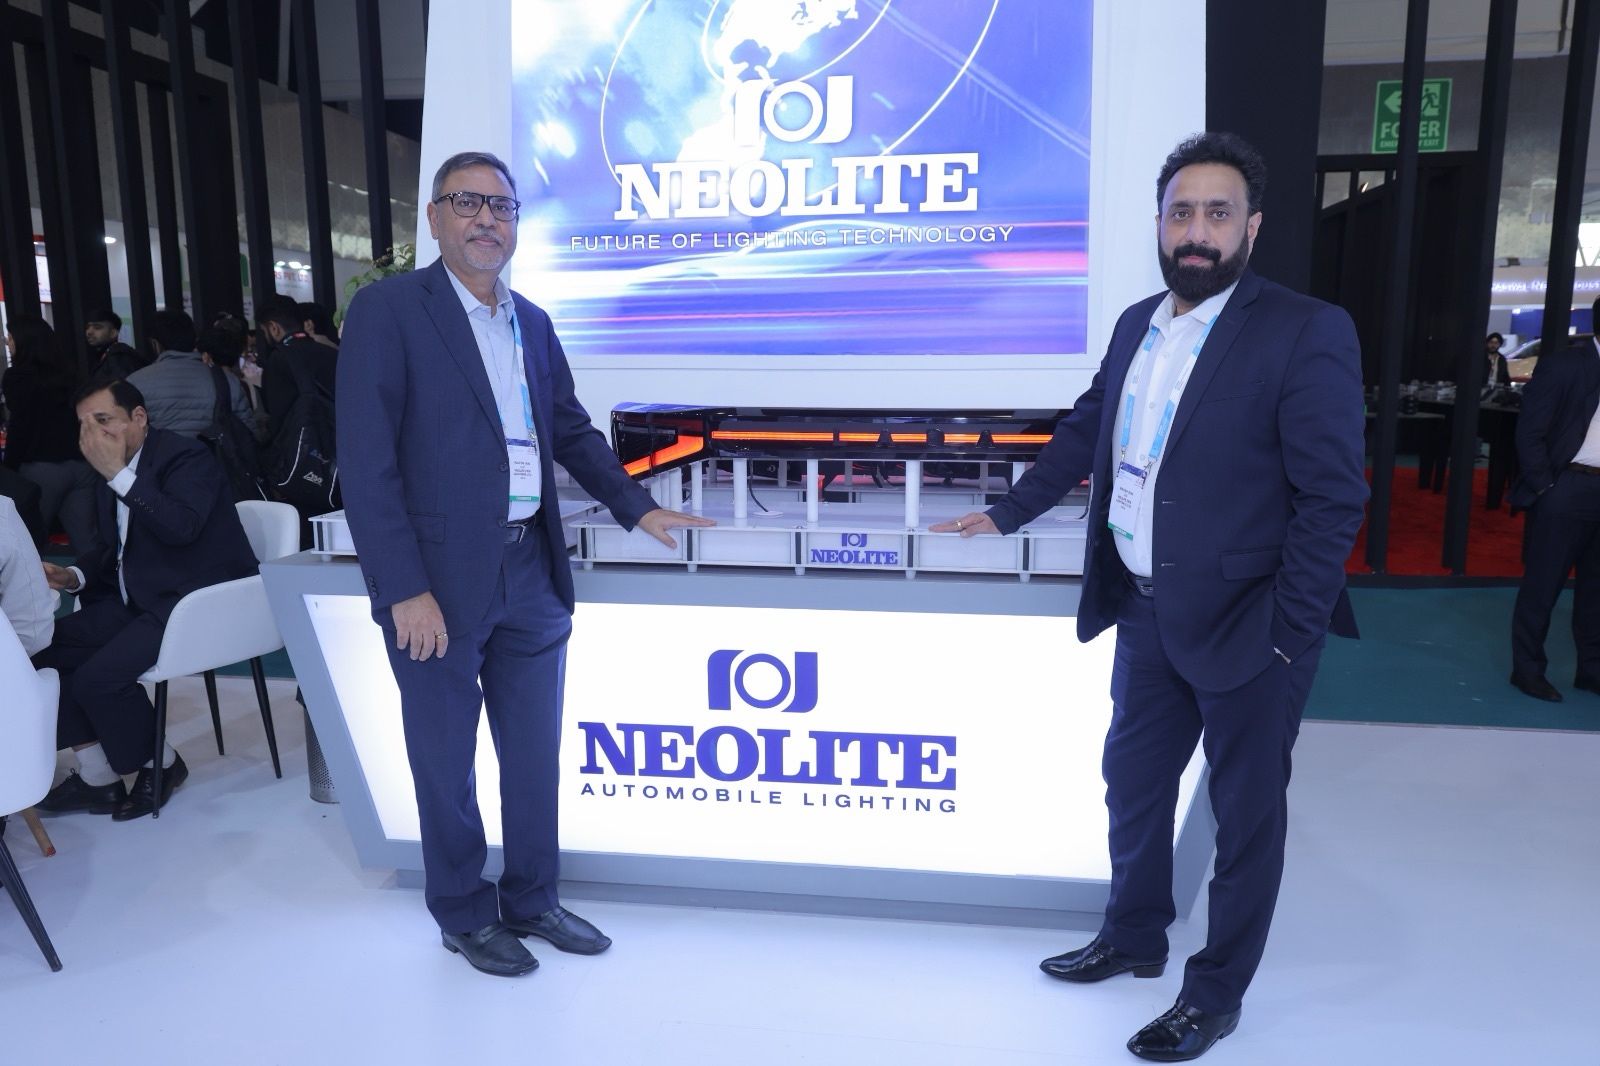



Pali Tripathi, CEO, Taabi Mobility, speaks to Ashish Bhatia on reconstructing the genuine loss hiden inside normal variation.
Q. Fuel has traditionally been treated as a cost of doing business, but not necessarily as a data problem. What made Taabi believe that fuel management needed to evolve from simple monitoring to forensic intelligence?
A. Fuel is the largest controllable operating cost for most commercial fleets, yet it has been managed through bills, averages and month-end exception reports. Those tell you how much was purchased and broadly how much was consumed. They do not tell you whether the fuel entered the tank, where it went, or why consumption changed.
The gap was never another dashboard. It was the absence of trustworthy evidence. Fuel behaviour is shaped by tank geometry, route, terrain, load, idling, driving style and refuelling process. Read separately, these variables let genuine loss hide inside normal variation. Read together, they let you reconstruct what actually happened.
So we stopped counting litres and started reconstructing events — what happened, when and where, what corroborates it, and what the fleet should do about it. That is the difference between fuel data you can observe and fuel data you can act on.
Q. Taabi began this journey in 2022. How has the problem statement evolved over the last four years, from visibility and measurement to Fuel Integrity AI™ and predictive risk detection?
A. We were formed in 2022 and went live on customer fleets in May 2023. The need was visibility into reliable fuel levels, refuelling, and consumption. Once we deployed on real fleets, it became clear that measurement alone didn’t solve the business problem. A fleet manager still had to interpret a noisy signal, make three phone calls, and then guess whether a loss was theft, leakage, underfilling or simply a hill.
The problem statement moved in three stages. Make the measurement dependable across vehicle and tank types. Convert continuous signals into contextual events by combining fuel data with location, movement, ignition and diagnostics. Then learn patterns across vehicles and operations so risk can be assessed before losses become habitual.
Fuel Integrity AI™ is that progression. It not only shows a deviation; it explains the likely cause, assembles the supporting evidence, ranks the incident and helps the customer close it. From seeing fuel, to understanding fuel, to anticipating where it will go missing.
Q. What makes Fuel Integrity AI™ fundamentally different from conventional fuel monitoring and telematics solutions? Is the real differentiation the accuracy of measurement, the quality of analytics, or the ability to interpret what is happening on the ground?
A. The differentiation is in the combination, not in any one layer. Accurate sensing is the foundation — unreliable input plus sophisticated analytics only produces confident errors. But accuracy alone is not enough, because in isolation an honest operational event and a theft event look much the same.
Fuel Integrity AI reads the shape and duration of a fuel change against the vehicle’s movement and ignition state, its location and route context, its refuelling history and, where available, OBD/CAN parameters. It then presents an incident rather than an alert.
Understanding ground operations matters just as much. A mining tipper, an intercity bus and a long-haul truck do not behave alike, and the models and thresholds have to reflect that. Trustworthy measurement, contextual intelligence, and actionable workflow- the advantage is that all three are present.
Q. You speak of 99 per cent (+) measurement accuracy across diverse vehicle categories. What were the biggest technical challenges in achieving this level of accuracy, particularly given variations in fluid dynamics driven by tank design, vehicle duty cycles, terrain and operating conditions?
A. 99 per cent is not a sensor and a calibration curve. Commercial-vehicle tanks vary enormously — irregular, baffled, tilted, and frequently modified in the field. The same change in fuel height can mean very different volumes at different points in the same tank. The signal is further disturbed by gradients, braking, cornering, vibration, temperature, load and duty cycle.
“Fuel behaviour is shaped by tank geometry, route, terrain, load, idling, driving style and refuelling process. Read separately, these variables let genuine loss hide inside normal variation.”
We therefore treat deployment as a measurement system, not a device: the right sensing configuration, tank-specific calibration, installation quality checks, signal conditioning, and validation against actual operating data. The algorithms separate transient slosh from sustained change, and calibration is refined by vehicle category and use case.
The hard part has been making laboratory precision survive Indian operating conditions — rough roads, mixed fleets, inconsistent processes, older vehicles. It comes from hardware discipline, calibration data, signal processing and continuous exception review. There is no universal formula.
Q. How do you separate genuine fuel theft or leakage from operational noise such as refuelling, idling, gradients, temperature changes, vehicle movement and other variables that can distort fuel-level data? What happens post-detection of theft?
A. We do not treat every downward movement as theft. The system first establishes context. Was the ignition on? Was the vehicle moving or stationary? On a gradient? How long did the change persist, and did the level settle at the new point? Was it near an approved station or site? Does engine consumption support it? Temperature, vibration and slosh leave characteristic patterns; a withdrawal, a leak or an underfill leaves a different sequence. All of it is read together, and against the vehicle’s own baseline.
Post-detection matters as much. A qualified incident is time-stamped, geo-tagged, carries its signal trail, and is classified by severity and probable cause. The fleet team verifies it against fuel slips, route records, driver inputs, CCTV or site process, assigns ownership and records the outcome. That closure feeds back into the model and into the operating control. Detection without a response workflow is just a second alert queue.
Q. Diesel theft is rarely a single event; it can involve pilferage, underfilling, siphoning on the move, collusion or manipulation of hardware and processes. How does your system identify and connect these seemingly independent signals to establish a forensic view of an incident?
A. We reconstruct an incident as a chain rather than hunting for one dramatic signal. Take underfilling. The invoice shows the authorised quantity, but the tank-level rise is lower; the location and time look valid, yet subsequent consumption and refuelling behaviour expose the mismatch. In siphoning, we see a sustained drop that the engine-consumption signature does not support, followed by movement or a repeated stop pattern. Tampering shows up as sensor interruption, implausible readings, power events, or a sudden break in the vehicle’s established data behaviour.
Individually, each of these is inconclusive. Correlated — fuel movement, ignition, location, route, dwell time, speed, diagnostics and history — they form a weighted evidence trail, and recurrence can be traced across a vehicle, driver, location, shift or vendor. That is what makes the view forensic. The conversation moves from ‘there was an anomaly’ to ‘these events explain the loss, and this is where the control failed’.
Q. How important is signal processing and behavioural analytics in this equation? Can the platform identify patterns that a conventional rule-based telematics system would simply classify as an anomaly? What’s the role of (OBD/CAN-bus) feeds, and can this be applied to pre-BSIV vehicles as well?
A. Raw fuel-level data is inherently noisy, so signal processing is unavoidable. Behavioural analytics is what gives the cleaned signal meaning. A rule-based system alerts whenever the level drops by a fixed number of litres. In practice, that rule either misses small repeated losses or floods the manager during normal operations. We look instead at the form of the event, its operating context, and how far it departs from that vehicle’s baseline. That surfaces patterns a threshold cannot — repeated small withdrawals, unusual night-time stops, consumption that diverges from route and load, refuelling behaviour tied to one location.
OBD/CAN feeds strengthen this with engine state, speed, odometer, load indicators and ECU-reported consumption. But the solution is not restricted to newer vehicles. Pre-BSIV assets are covered through calibrated fuel sensing with GPS, ignition and movement data. The confidence model works with whatever signals are available, and says so.
Q. False positives have historically been one of the biggest barriers to fleet adoption of fuel-management technology. How has Taabi approached the balance between being sensitive enough to detect theft and intelligent enough not to penalise legitimate driver behaviour?
A. At three levels. Measurement quality — correct installation and calibration kill a large share of bad alerts before analytics begins. Context — a level change is judged with movement, ignition, location, time, persistence and the vehicle’s normal pattern. Confidence and workflow — a raw deviation is not the same thing as an actionable incident, and the system should not present them as though they were.
We would rather give a fleet manager a handful of well-supported cases than a queue nobody can investigate. Investigation outcomes come back as feedback — legitimate refuelling, operating exception, or real loss — and sharpen thresholds for that fleet.
The design point is that evidence must be sufficient before an allegation is made. That is what earns adoption: drivers and managers both know a decision rests on context, not on one sensor fluctuation.
Q. As drivers and operators become familiar with monitoring systems, behaviours can evolve. How does adaptive anomaly detection respond to new patterns, deliberate tampering or attempts to circumvent the system?
A. Any static control eventually becomes familiar to the people working around it. So detection is built on moving baselines and combinations of signals rather than a fixed threshold. The platform learns the normal fuel and operating behaviour of a vehicle or cohort and watches for meaningful departures — including patterns that stay individually small but become suspicious through repetition.
Deliberate tampering tends to announce itself indirectly: sensor disconnection, power interruption, flat-lined or implausible data, a changed relationship between fuel movement and engine use, or gaps that keep coinciding with a particular place or shift. Those are raised as integrity risks even when the physical act itself is never observed. Confirmed incidents and false alarms are fed back in.
I would not claim that circumvention becomes impossible. The aim is to make manipulation progressively harder to hide, because the full set of signals and records has to stay consistent.
Q. At what point does an anomaly become actionable intelligence? Can you walk us through what a fleet manager sees from the first signal or deviation to the forensic evidence and eventual intervention?
A. An anomaly becomes actionable when it carries context, confidence, business impact and a next step. The fleet manager sees a prioritised incident, not a stream of readings — a probable withdrawal of a stated volume, at a location, at a time. Opening it shows the fuel trace, vehicle state, movement and ignition context, route and stop information, recent refuelling history, and the reason it was classified as it was. From there, the manager compares it against authorised activity, calls the driver or the site, attaches a slip or a CCTV check. The case is assigned, acknowledged and closed with an outcome. Severe or repeated patterns escalate; aggregated views point to the risky locations, vehicles, routes and vendors.
The closed loop is the point. Value is created when the insight changes something — a recovery, a corrected underfill, a repaired leak, a tightened route control, or a driver recognised for consistency.
Q. Fuel management has often been perceived as a surveillance exercise, particularly by drivers. How did Taabi build a model where technology protects the interests of both the fleet operator and the driver?
A. The system should not open with the assumption that the driver is at fault. Drivers are routinely blamed for variance that comes from poor calibration, a leak, deferred maintenance, dispatch decisions, road conditions, or the refuelling process itself. An objective evidence trail protects the driver from an arbitrary accusation exactly as it protects the operator from genuine loss.
We design the operating model around transparency: say what is being measured, keep efficiency coaching separate from disciplinary investigation, and acknowledge good performance. Used consistently, the data ends arguments that would otherwise run on estimates and suspicion.
This matters in an industry where drivers already work in hard conditions, and trust is thin. Adoption is strongest when the driver can see something in it — fewer disputes, faster resolution, a safer vehicle, credit for good work.
Q. The idea of ‘Izzat ki Kamai’ is particularly interesting. How can better fuel intelligence translate into greater trust, accountability and potentially better earnings or recognition for drivers rather than simply becoming another control mechanism?
A. ‘Izzat ki Kamai’ is the idea that technology should strengthen the dignity of honest work. In many fleets, a driver is penalised because actual mileage differs from a crude benchmark — never mind that the reason was load, traffic, terrain, an hour idling at a customer’s gate, or a maintenance issue nobody fixed. Better fuel intelligence separates what the driver controls from what the operating environment imposes. That makes a fair scorecard possible, and a credible incentive on top of it. A driver who follows the route, refuels correctly, avoids wasteful idling and delivers consistently can be recognised — a bonus, preferred trips, training, or simply being named.
The mechanics matter as much as the intent. An incentive calculated by hand at month-end tends to arrive late or arrive wrong, and a driver stops believing in it. We are automating that reconciliation so the number is built from the same data the driver can see.
When a dispute does arise, the same evidence protects him from a blanket deduction. Accountability does not go away; collusion and theft have to be dealt with. But it rests on corroborated events rather than presumption.
The best outcome is not only a lower fuel bill. It is a system where honest drivers earn more, build a record that travels with them, and find that the technology is working with them.
Q. How much of the value lies beyond the fuel saving itself? Can fuel data reveal broader operational issues around vehicle utilisation, route discipline, driver behaviour, maintenance or supply-chain inefficiencies?
A. Fuel is a powerful operational signal because it sits at the intersection of vehicle, driver, route and process. Abnormal consumption may mean aggressive driving or excessive idling. It may equally mean an injector problem, low tyre pressure, a leak, overloading, route deviation, or a vehicle running in the wrong duty cycle. A gap between planned and actual refuelling exposes process weakness or a vendor issue. Repeated inefficient stops point to dispatching, detention or route design.
Combined with diagnostic, location and trip data, the question changes from ‘why is mileage low’ to ‘which of these is causing it’. The financial value follows — better utilisation, lower maintenance cost, disciplined routes, tighter vendor control, and far less management time spent reconciling claims. In most deployments, the compounding benefit is that operations, finance, maintenance and security are finally working from the same version of events.
Q. How are onsite and remote analytics increasingly converging in fleet management? What decisions can now be taken remotely that previously required a supervisor or fleet manager to physically be present?
A. They are converging because the physical event can now be captured at the asset and interpreted centrally. Validating a refuelling, identifying a probable withdrawal, detecting abnormal idling, checking route adherence, spotting a diagnostic risk, prioritising vehicles for inspection — all of it once needed a supervisor with a dipstick, a slip and a phone. Edge intelligence keeps capturing and filtering events where connectivity drops; the cloud supplies fleet-wide context, pattern recognition and workflow.
This does not remove the need for people onsite. A leak still has to be inspected, and an incident still has to be verified locally. What changes is where human attention goes — not supervising every vehicle continuously, but the few events where the evidence and the money justify it. That is worth most in distributed fleets, mines, construction sites and multi-depot operations, where physical oversight is expensive and uneven.
Q. Do you see the future fleet control room moving from dashboards that report what happened to AI systems that explain why it happened, predict what could happen next and recommend the action to take?
A. Yes. Dashboards made fleet activity visible, which was a necessary first step, but a dashboard still expects the manager to find the problem and work out what it means. The next control room should behave more like an operating partner: detect a material deviation, explain the likely cause, size the impact, project what happens if it continues, and recommend the action. It should not simply show declining fuel efficiency — it should say whether the probable cause is driver behaviour, route and load, mechanical deterioration, a leak or a refuelling irregularity, and route the case to whoever owns it.
Some of this is already running. We have agents in beta doing the clerical work around a recommendation — pulling the records, comparing a fuel slip against the actual tank-level rise, raising the case, routing it to an owner and following up until it is closed. The one furthest along is driver incentive reconciliation. In most fleets, that is still a month-end spreadsheet exercise: trip records, fuel efficiency, idling and route adherence assembled by hand, and as a result paid late or paid wrong. An agent can build it from data the platform already holds.
We have kept the boundary firm. Agents do the assembly and the chasing; a person makes the consequential call. That matters most where an incident could become an allegation against a driver. The shift is from passive reporting to assisted execution. The most valuable AI will not be the one that generates the most alerts. It will be the one that helps an operating team prevent loss and close decisions faster.
Q. How significant is Taabi’s proprietary data in this evolution? After four years of observing real-world fleet operations, what can your data now tell you that generic AI models or conventional telematics cannot?
A. Generic models can reason over information. They do not know how fuel behaves in an irregular truck tank on a gradient, what a particular sensor fault looks like, or how a mining duty cycle differs from long-haul.
We have been live on customer fleets since May 2023, and in that time we have observed diverse vehicle categories, tank geometries, routes, operating environments and — importantly — investigated outcomes. That gives us a library of signal signatures together with the context and the feedback needed to interpret them. The advantage is not the volume of data. It is the linkage between raw signal, vehicle condition, customer process and confirmed outcome, which is what allows fleet-specific baselines, better confidence scoring and faster deployment into a similar use case.
Customer data is handled with the corresponding controls. Proprietary intelligence should mean better models and benchmarks, not one customer’s information turning up in another’s.
Q. What has been the measurable business impact for customers using Fuel Integrity AI™? How much of the value proposition comes from preventing direct fuel loss versus improving overall fleet efficiency?
A. Impact varies by fleet, because starting leakage, operating discipline and duty cycle vary. So we baseline first and track a value waterfall rather than quoting one universal saving.
Our floor commitment is a five per cent improvement in fuel efficiency. On an Indian truck, Rs. ₹7,500 to Rs. 8,000 a month, and payback within three months. What we actually see is usually higher. One transporter running 2,000 vehicles began with a 40-truck pilot, reached a 12 per cent improvement in fuel efficiency, and then took it past 500 trucks.
That deployment also answers the second half of your question. Pilferage-related anomalies fell 68 per cent within 60 days — and most of that was deterrence rather than recovery, because drivers knew the tank was finally being read accurately. Deterrence alone accounted for roughly 40 per cent of the total fuel saving. The rest came from idling, route and refuelling discipline, and earlier detection of mechanical problems.
So the answer depends on where the fleet starts. In a poorly controlled operation, stopping direct loss gives the fastest payback. In a mature fleet, the bigger prize is small efficiency gains across thousands of trips. We keep each saving traceable to an operational action — more credible, and more useful to management, than crediting every movement in the fuel bill to the technology.
Q. During the recent energy crisis, how did customers using the platform respond differently? Were there instances where early intelligence around fuel consumption or pilferage materially helped fleets protect margins and maintain operations?
A. What made this one hard was that it was compressed. Prices were held flat through the election cycle even as crude climbed past USD 100 on the Hormuz disruption, and then diesel moved roughly 8.6 per cent in 10 days in the second half of May — four revisions, to about Rs. 95 a litre in Delhi, the highest since 2022. Fuel is 50–60 per cent of a fleet’s operating cost. An increase of that size arriving inside one billing cycle leaves an operator no glide path at all.
The fleets that coped were the ones that already knew where their fuel was going. Our customers could see consumption by vehicle, route and operating condition, and could separate genuine business demand from avoidable loss. Teams prioritised high-variance assets, tightened refuelling controls, caught underfilling and pilferage earlier, and acted on idling and route deviation before it accumulated. The difference was speed — material events were investigated close to when they happened, rather than at a month-end reconciliation that by then described a price which had already changed twice.
It also changes the arithmetic of the investment. The same five per cRs. ₹87, so the payback on control shortens exactly when the operator is least able to spend. The 2,000-vehicle transporter is the clearest instance. The pilot surfaced route-specific pilferage and underfilling hotspots that had been invisible inside a monthly average, and closing them changed both the cost line and the accountability around it.
Fuel prices, freight rates, loads and service levels all interact, so I would not attribute margin protection to one tool. But timely intelligence gives an operator more levers, and a modest gain in control is worth a great deal when margins are compressed.
Q. How does the solution scale across very different operating environments, from long-haul road transport to mining, construction, buses and other intensive-duty applications?
A. The architecture is common; the deployment and the models are not. Long-haul needs strong route, stop, refuelling and on-road incident context. Buses have repetitive routes, fixed schedules and predictable idling. Mining and construction assets work on gradients, under vibration, with irregular duty cycles inside geo-fenced sites — and there, connectivity and ruggedisation matter far more. Tank geometry, sensor installation, calibration approach, event thresholds and benchmark cohort are configured per use case, and edge capture keeps the system useful where connectivity is intermittent.
Scale then depends on implementation discipline: standard hardware configurations wherever possible, a repeatable calibration and quality process, remote device health monitoring, APIs into existing fleet systems, and role-based workflows for different teams. We are not trying to force every customer into one definition of normal. We are using one platform to learn the right normal for each.
Q. What is the next frontier for Taabi? Do you see Fuel Integrity AI™ becoming one module within a broader AI-led operating system and a broader universe for securing fleet and supply-chain intelligence?
A. Fuel Integrity AI is one module in a broader AI-led operating system for fleets and asset-heavy enterprises. Fuel cannot be optimised in isolation from vehicle health, driver risk, trip execution, route compliance, maintenance and the movement of goods.
Our direction is to bring those signals into a single asset-intelligence layer and add agentic workflows on top, so teams can investigate, decide and close. The first of those are in beta now. A fuel anomaly may need a driver check, a maintenance inspection, a vendor reconciliation or a security response — the platform should carry that chain instead of leaving the customer to move between four systems. The same intelligence extends into plant and yard operations, video safety and transport management.
The larger opportunity is to secure not just the fuel tank, but the economics and integrity of the entire movement — vehicle, driver, cargo, route and transaction.
“Edge intelligence keeps capturing and filtering events where connectivity drops; the cloud supplies fleet-wide context, pattern recognition and workflow.”
Q. Looking five years ahead, what will a truly intelligent commercial fleet look like? And what are the biggest barriers — technology, data quality, adoption, economics or human behaviour — that the industry still needs to overcome? A word on securing long-haul freight to sum up.
A. It will sense its own condition, understand context, and continuously recommend the safest and most economical action. Vehicles, drivers, trips, fuel, maintenance and cargo will stop sitting in separate silos. The control room will manage exceptions and predicted risk, routine follow-up will be automated, and consequential decisions will still belong to people.
The barriers are not algorithms. They are trustworthy data, installation quality, interoperability, frontline adoption, and the ability to prove ROI. Human behaviour most of all — systems fail when they are used only to punish, when alerts are never closed, or when the operating process does not change to match what the data says.
Securing long-haul freight needs layered intelligence: fuel integrity, vehicle health, video and driver safety, route and stop risk, cargo visibility, and a response workflow that someone owns. The point is not surveillance for its own sake. It is a fleet where every material risk is detected early, explained fairly, and acted on quickly.