

This research focuses on reducing the mileage of open-road brake tests by simulating brake patterns on dynamometers, writes Fabio Squadrani, Senior Manager, Braking Systems in Applus IDIADA.

Modern braking systems development is moving towards the reduction of long tests on open roads. However, one of the most critical items when reducing the mileage in open roads is brake wear. This work answers a simple question about how to simulate brake patterns in dynamometers to reduce the mileage of brake tests to be performed on vehicles. In the first part of this article, a set of data coming from a brake durability test was analysed. Particularly this is needed to define the target wear value for the brake dynamometer procedure.
Ø Brake Dynamometer Testing
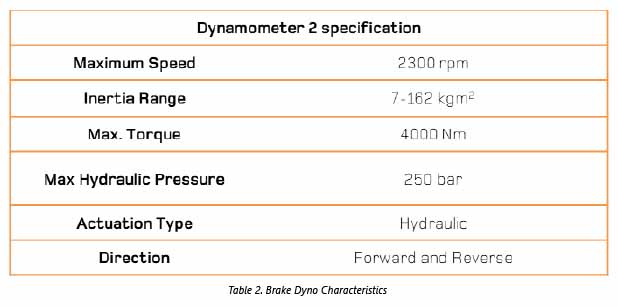
The fixture is mounted on the Applus IDIADA PC2 (Passenger Car 2) dynamometer. This dynamometer is a full-scale dyno, which can replicate the exact vehicle performance, at its corresponding inertia. The specifications of the dyno is as follows:
Ø Route classification and selection
To reproduce the routes on the dyno the first important element is the selection of a representative route. First of all, a standard Mojacar route is made of the following main sections:
a. Bedding routes
b. Country road routes (usually
called Lubrin Routes)
c. Highway routes.
To select representative routes for wear correlation purposes, both bedding routes and highway routes are not considered. The first ones because they are considered as not representative of the study. The motorway routes, instead, are assumed not to be contributing to the wear generation.
In addition to this, the following snubs are also eliminated:
n Snubs at low speed (<3 km/h)
n Snubs in the noise search area
n Snubs where the difference
n between initial and final speed
n is less than 3km/h
In this way, the average mileage for each route in the dyno is calculated to be 125 km.
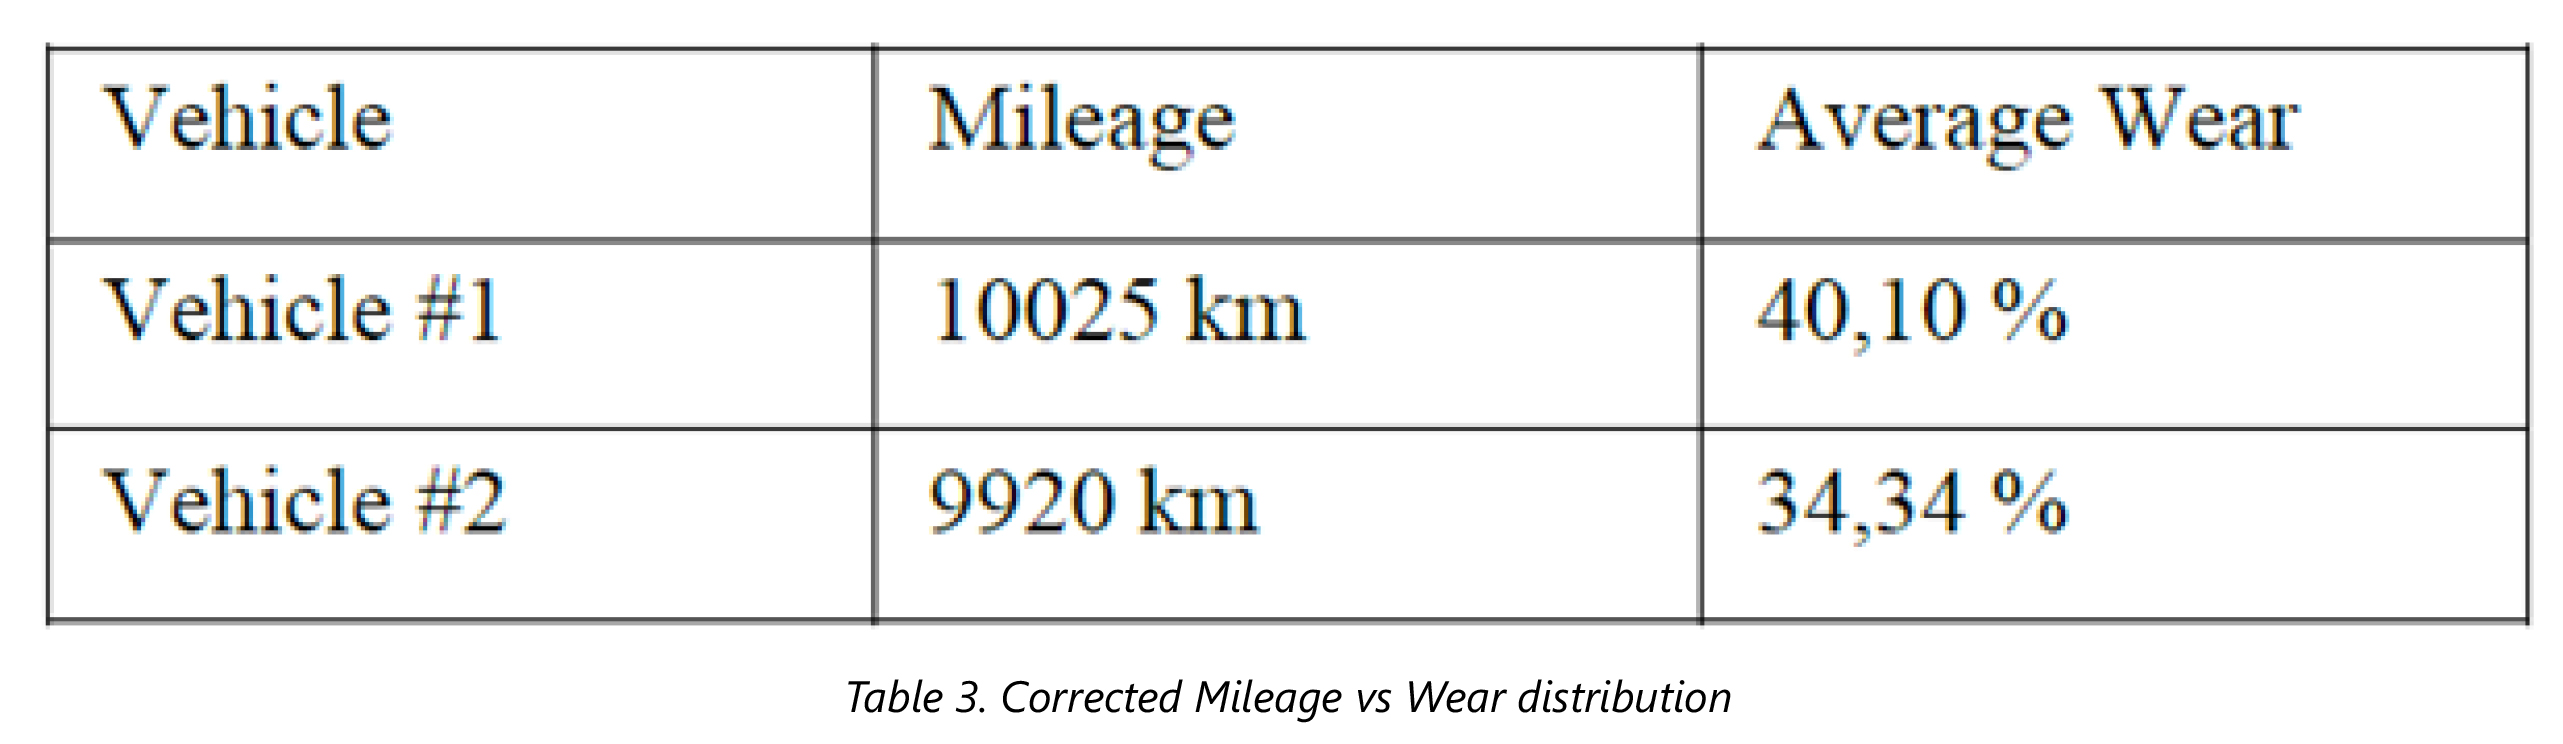
Under this criterion, the mileage of the test is modified as follows:
No impact on the average wear is assumed.
A statistical analysis was conducted on the relevant routes from the Mojácar durability test and it is aimed to identify the most representative route to be replicated in the brake dyno simulation. Various parameters were computed for each route, including net kinetic energy, thermal energy and power, brake load and power factors, number of brake applications, and average front temperatures.
A Gaussian curve-based classification was performed to select the route that best represented the average figures across these criteria. This selected route was then used as the basis to develop a repeatable dyno test pattern.
Ø To clarify the steps for this statistical analysis are as follows:
Step 1: All the relevant parameters are calculated for each route
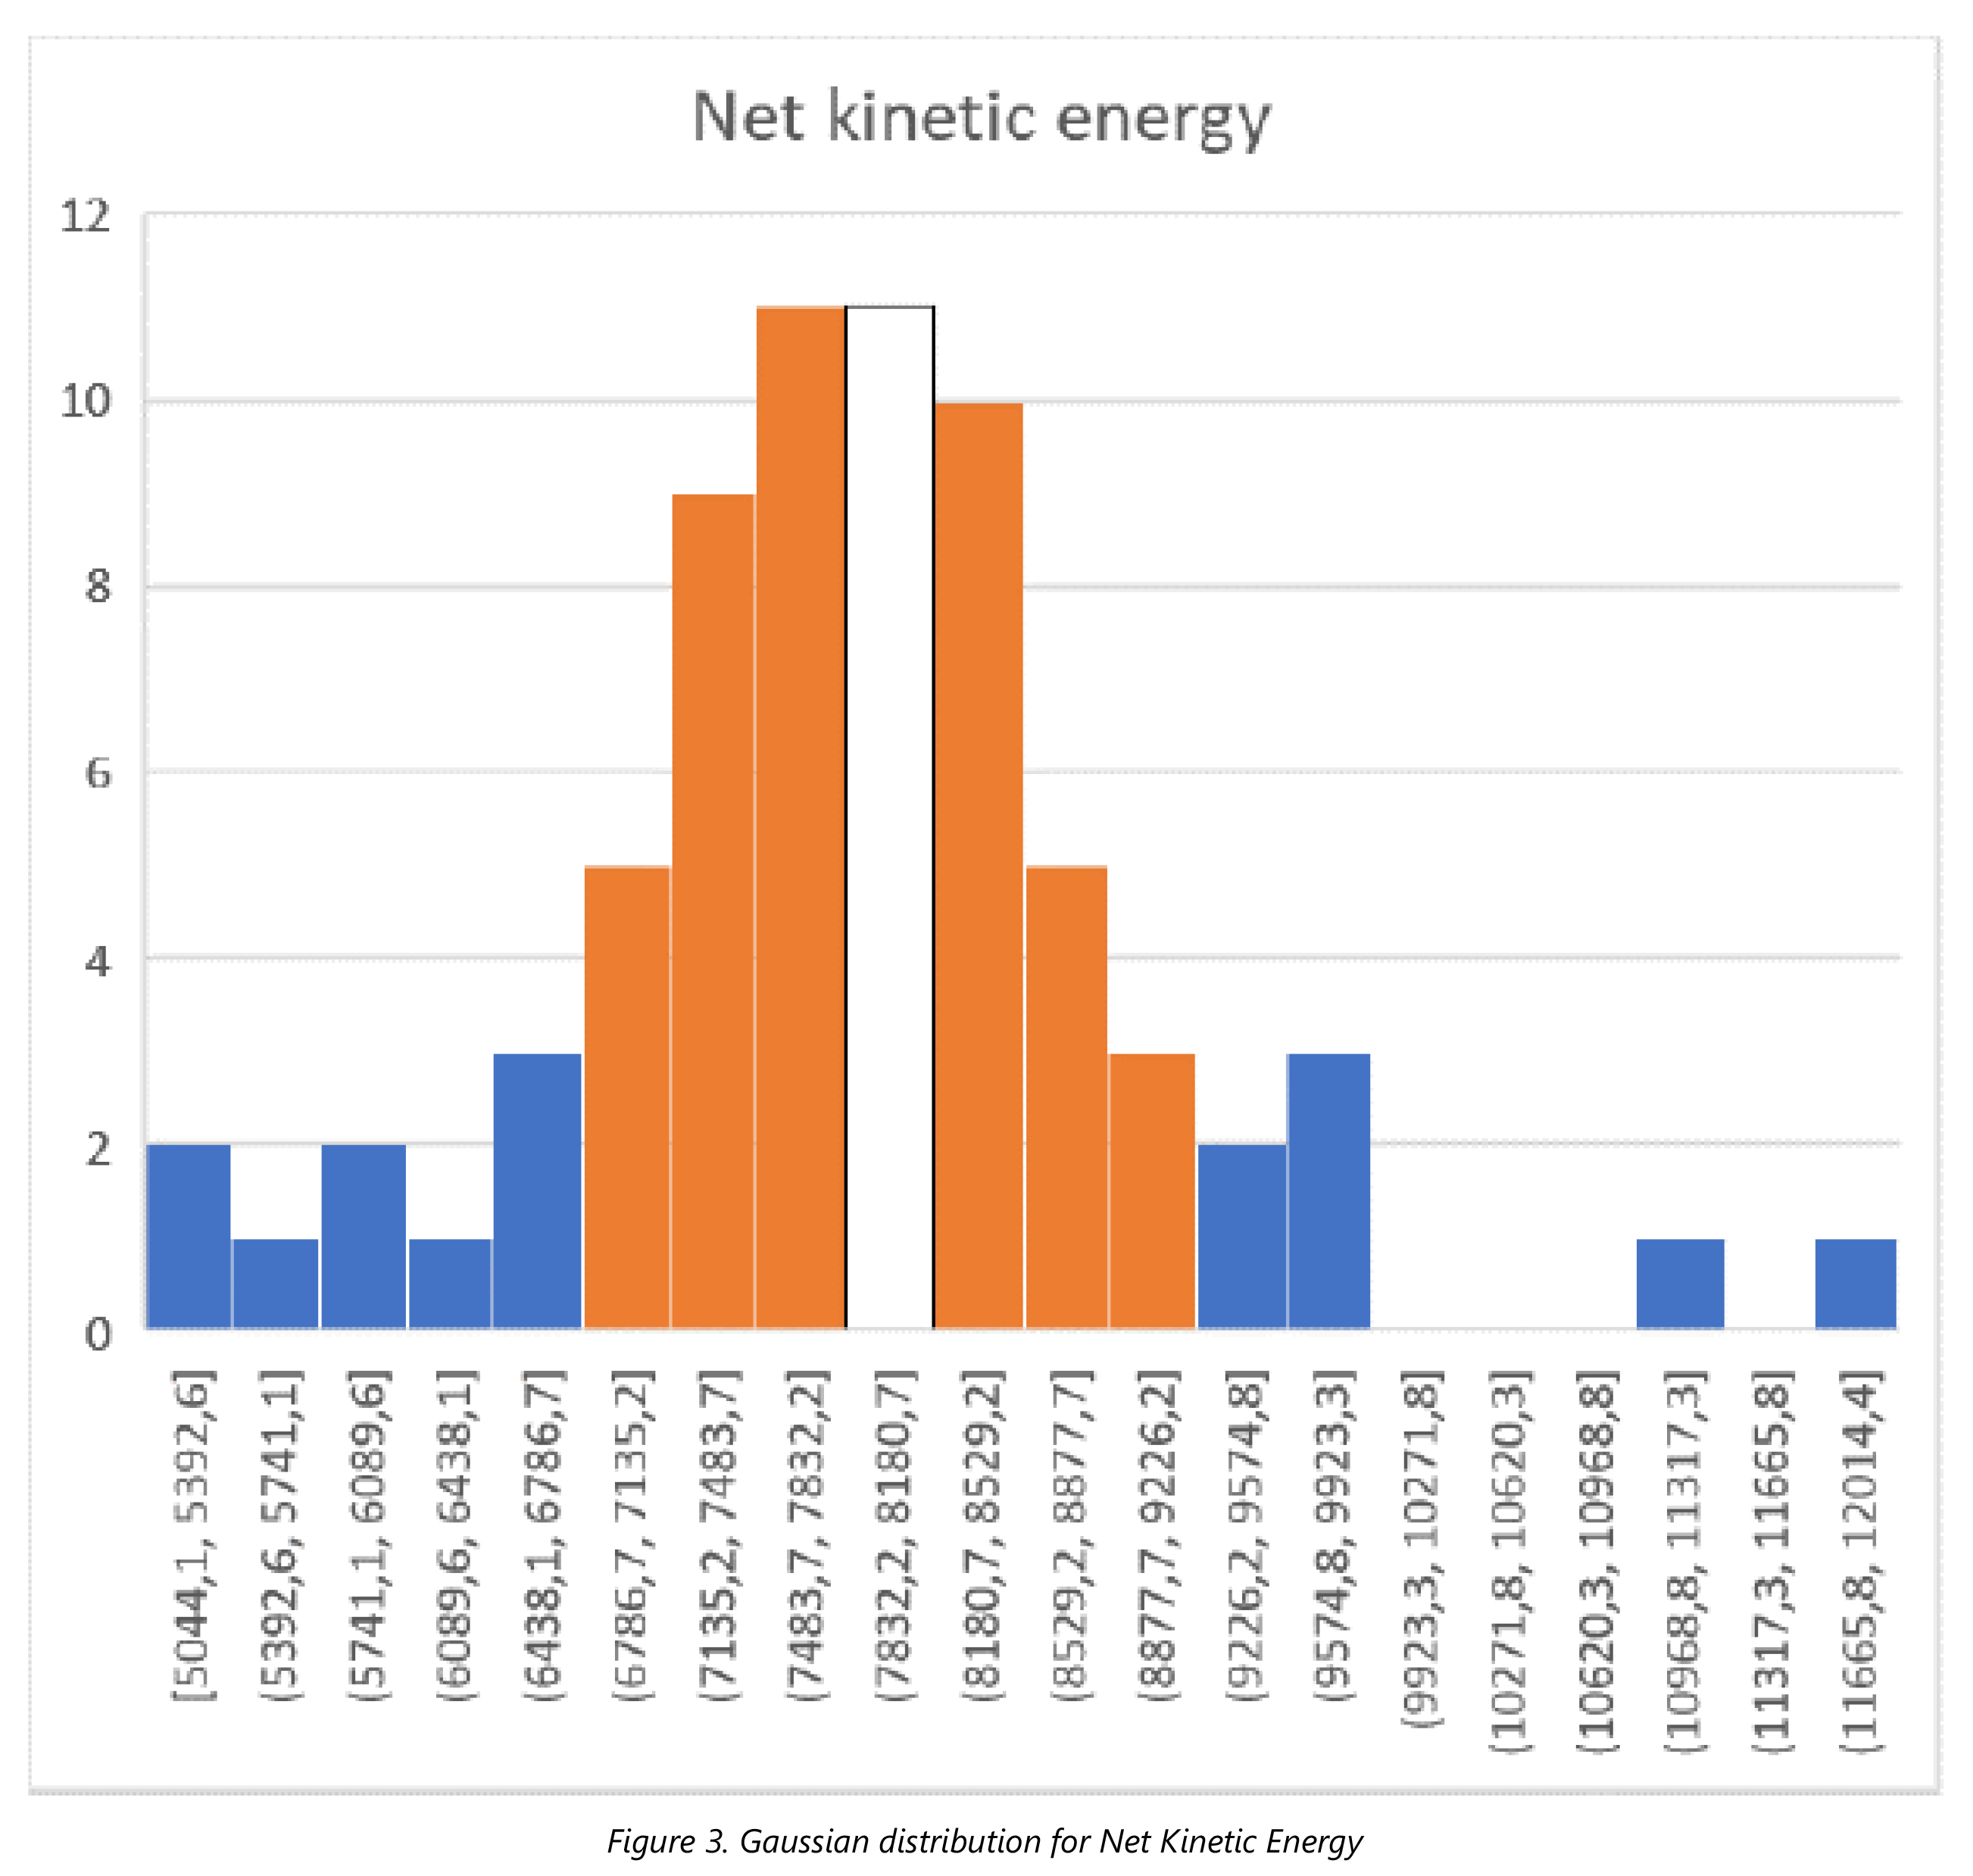
Step 2: All the routes are classified in a Gaussian distribution (per each parameter) to identify the most representative value per each parameter. For instance, for the Net kinetic energy [kJ], the Gaussian distribution of the routes is as follows:
Figure 3. Gaussian distribution for Net Kinetic Energy
Step 3: Each route is classified according to its distance from the Gaussian distribution for each parameter. The closest route to the Gaussian distribution is selected and is called the “reference lap”.
Initially, the aim was to consider only one representative route to be repeated a certain number of times. This would be the so-called Reference Lap: the selected lap, with its corresponding IBT (initial brake temperature) for each snub.
However, to guarantee the representativity of the variability coming from road testing, three levels of initial brake temperature are defined and three different laps are defined:
a. Reference Lap: the selected lap,
with its corresponding IBT (initial
brake temperature) for each snub
b. Low-Temperature Lap: the
reference lap, where the IBT of
each snub is reduced by 15%
c. High-Temperature Lap: the
reference lap, where the IBT of
each snub is increased by 15%
It is considered that this step is crucial to select the correct route for the right correlation.
To clarify how the limits for Low and High temperatures are defined, it can be said that this is coming from the analysis of experimental data. The reference lap temperature is the average coming from the Gaussian curve-based classification. The limits are coming again from the same curve and that’s why the distribution is purely symmetrical.
Ø The importance of the bedding section
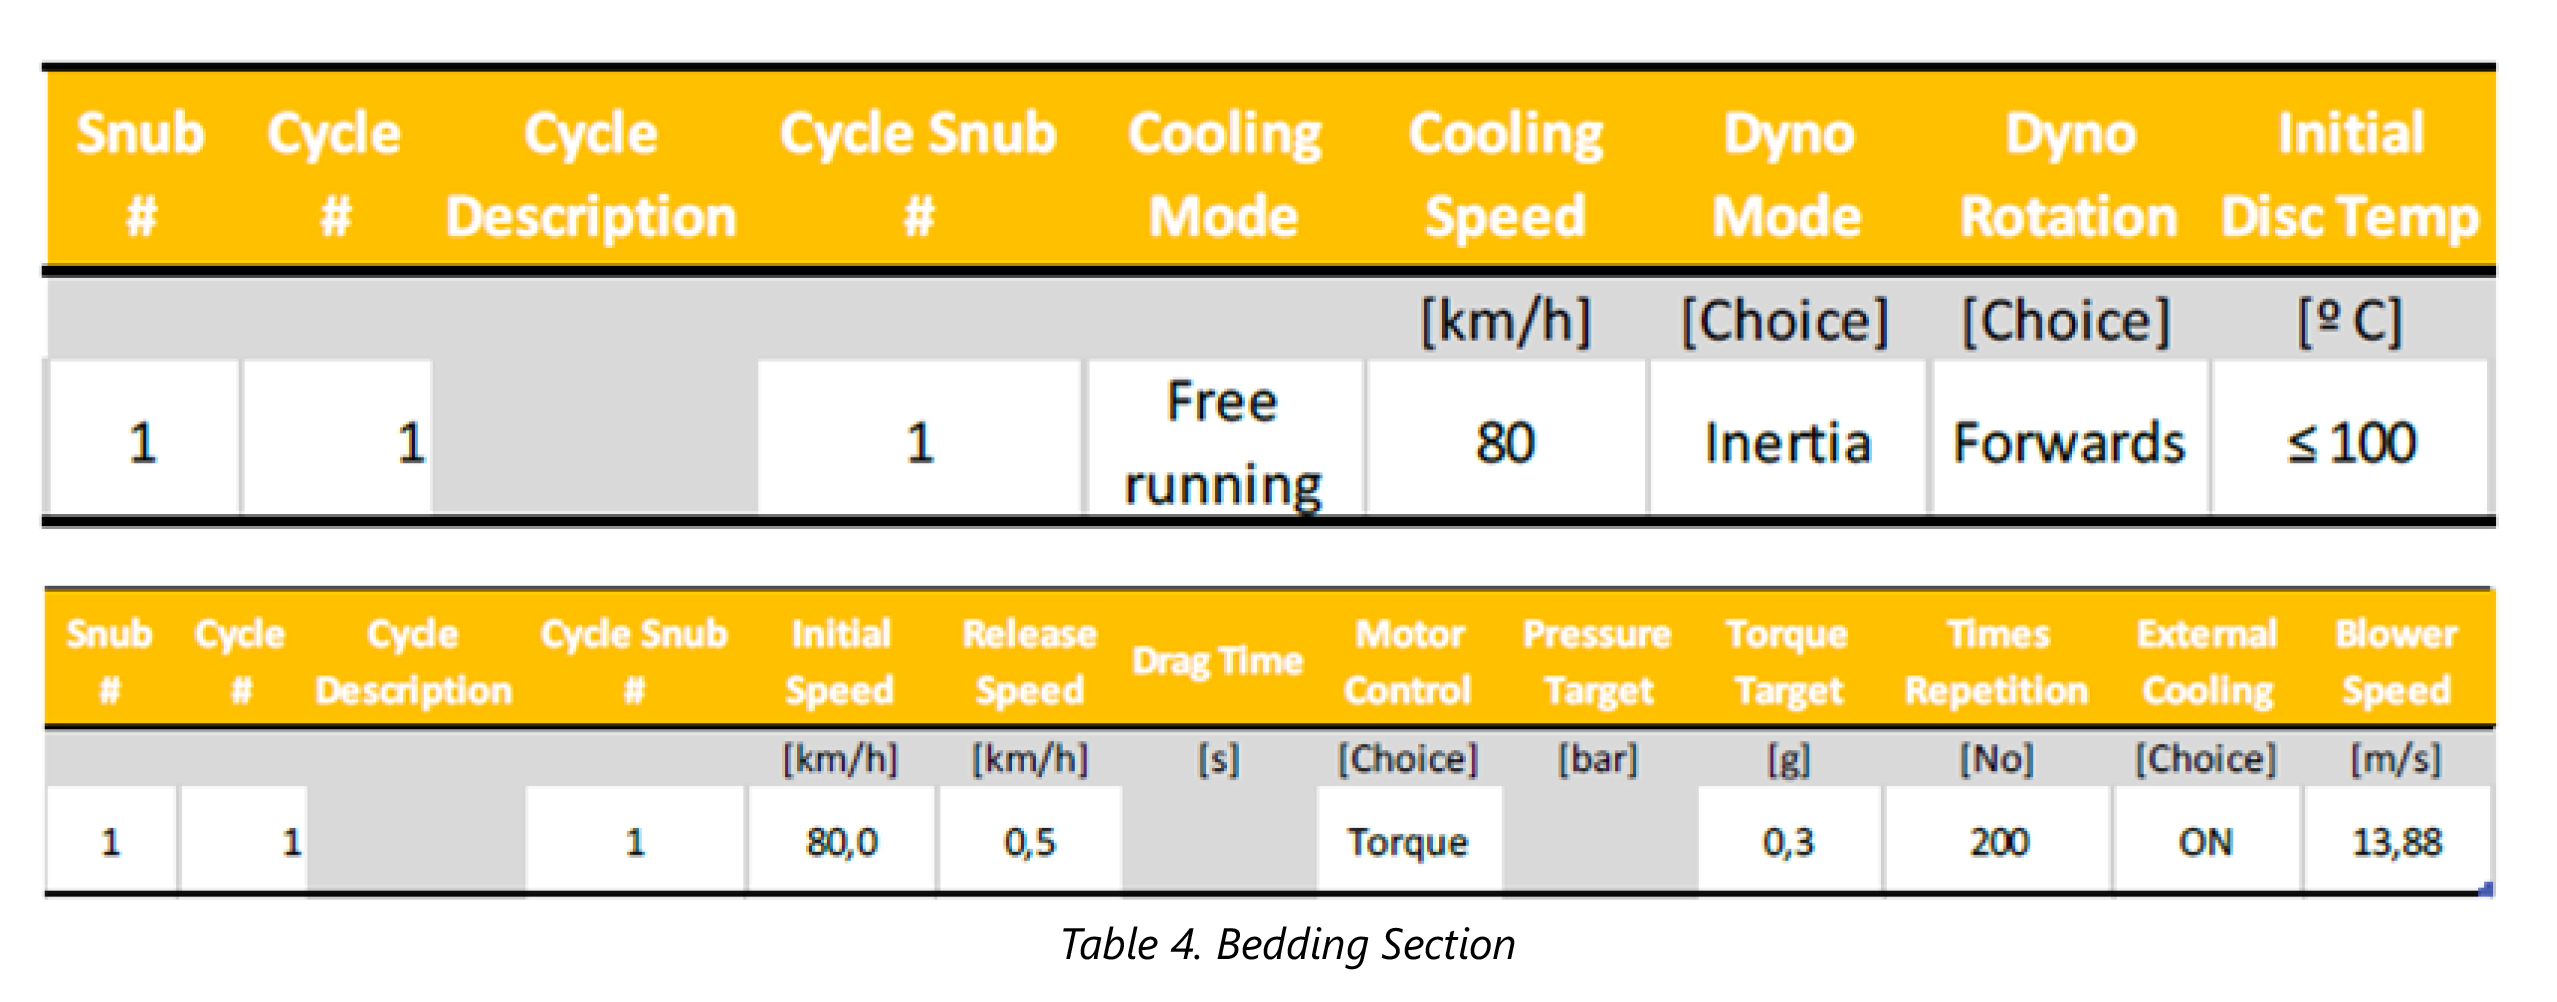
For wear, but also performance and noise purposes, the bedding section of a vehicle or dyno project is of paramount importance. For this particular application a very simple process of bedding the brake with 1 simple running in process according to SAE J2707 brake dynamometer procedure has been carried out.
The procedure for carrying on the bedding on the brakes is summarized in the following tables:
Ø Scale factor calculation
The main objective of such a correlation study is obviously to reduce testing time and impact development for the right material selection at the very beginning of a DVP programme.
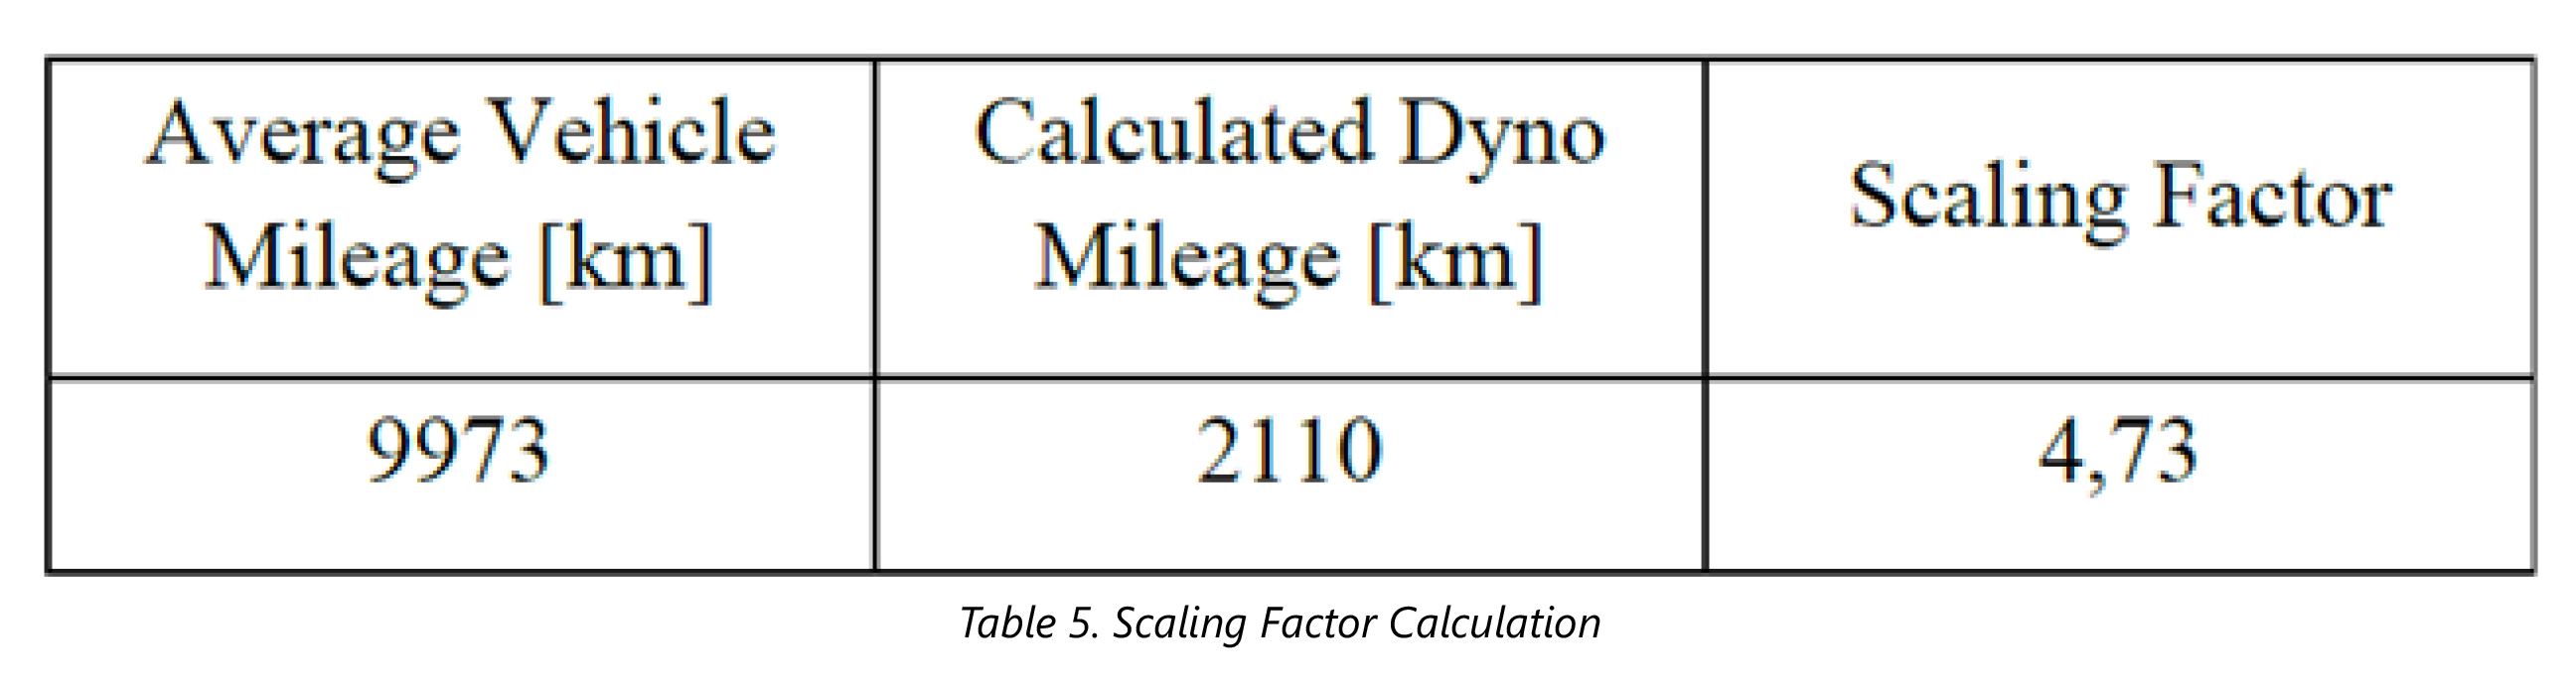
In this way a simple scaling factor is defined, considering the total mileage on the vehicle divided by the total simulated mileage on the dyno. It has to be said that the total mileage on each route is calculated to be 125 km and that the bedding section is assumed to be slightly shorter than that.
The main aim is to define a quick procedure that could be run in a dyno, with an objective testing time of 3-4 days maximum (on a three-shift dyno usage basis).
To do this a target scaling factor (total mileage on the vehicle divided by the total calculated mileage on dyno) is between 4.5 and 5.
So, after some basic energy and power considerations, the following mix has been proposed as a structure for the dyno validation procedure:
a. Bedding Section according to
SAE J2707
b. 2 Low-Temperature Laps (the
reference lap, where the IBT of
each snub is reduced by 15%)
c. 12 Reference Laps: the selected
lap, with its corresponding IBT
(initial brake temperature) for each
snub
d. 2 High-Temperature Laps: the
reference lap, where the IBT of
each snub is increased by 15%
In this way the scaling factor is calculated as follows:
————————————-
With over 25 years’ experience and 2,450 engineers specializing in vehicle development, Applus IDIADA is a leading engineering company providing design, testing, engineering, and homologation services to the automotive industry worldwide.
————————————
The views expressed by the authors are their own and do not necessarily reflect the views of ACI Magazine.


Leave a Reply